How A Cryptocurrency Miner Made Its Way onto Our Internal Kubernetes Clusters

The explosion of cryptocurrency in recent years spurred a wave of exploits targeting unsuspecting machines to mine cryptocurrency for the attackers. Earlier in the year, the JW Player DevOps team discovered one of the aforementioned miners running on our development and staging Kubernetes clusters.
To be clear, our production cluster was not affected, no JW Player customer data was accessed or exposed, and service was uninterrupted. Malicious actors are not always intent on stealing information or taking a website down, they can be just as content (or more so) in stealing your compute power. We take any intrusion very seriously though, and wanted to share our findings to help other DevOps teams harden their systems.
This blog post is broken up into several parts detailing — discovery and diagnosis, our immediate response, discovering and replicating the attack vector, damage assessment, and plans for preventative measures to further protect our systems.
Discovery
Day 0, 21:06 EST: Datadog alerted us (the DevOps team) to a high normalised load average on our staging environment. The cause of the high load averages was determined to be an increased load on one of our legitimate services. This was normal behaviour.
Day 1, 2018, 16:53 EST: Another Datadog alert was triggered with the same high normalised load average issue, this time on our development environment. That same service repeatedly triggered alerts from it constantly scaling up and scaling down on both development and staging environments. Due to the initial triage of the previous alert and the volume of incoming alerts of the same type, those alerts were muted until the flux stabilised.
Day 3, 17:40 EST: The increased load over the course of 4 days across both clusters was no longer considered normal. Further investigation was necessary to either address the increased load or tweak the Datadog monitors. I logged onto one of the Kubernetes instances via SSH and examined resource consumption using top. A gcc process ran at 100% CPU utilisation and was an immediate suspect for high load averages on the machine. This process was found to be running across every machine in the development and staging clusters.
Diagnosis
Note: All terminal output has been truncated to only show relevant information. A truncated output is denoted with an ellipsis ... .
Initially, I believed a defective container was launched through our internal deployment tool and ran gcc. However since the master nodes were affected, that hypothesis seemed incorrect. Since JW Player follows the practice of keeping infrastructure as code, I double checked our repositories for any applied yaml configurations or deployments that ran gcc and found nothing suspicious.
For further visibility into why gcc would be running at all, I inspected the process:
admin@ip-10-10-201-13:~$ cat /proc/29254/status
Name:    gcc
Umask:    0022
State:    S (sleeping)
Tgid:    29254
Ngid:    0
Pid:    29254
PPid:    3391
...
admin@ip-10-10-201-13:~$ ps aux | grep 3391
root      3391  0.0  0.0 413632  3740 ?        Sl   Sep05   0:00 docker-containerd-shim 7f8f77e3ad08b863841cadc833577f27062ed398546f663a8a77f778ba6c8d3d /var/run/docker/libcontainerd/7f8f77e3ad08b863841cadc833577f27062ed398546f663a8a77f778ba6c8d3d docker-runc
Strange. A Docker container is running gcc despite our code base stating otherwise. Inspecting the Docker container reveals that Weave Scope was the parent process:
admin@ip-10-10-201-13:~$ sudo docker inspect 7f8f77e3ad08b863841cadc833577f27062ed398546f663a8a77f778ba6c8d3d
[
    {
        "Id": "7f8f77e3ad08b863841cadc833577f27062ed398546f663a8a77f778ba6c8d3d",
        "Created": "2018-09-05T17:45:20.073800454Z",
        "Path": "/home/weave/scope",
        "Args": [
            "--mode=probe",
            "--probe-only",
            "--probe.docker.bridge=docker0",
            "--probe.docker=true",
            "--probe.kubernetes=true",
            "weave-scope-app.weave.svc.cluster.local:80"
        ],
        "State": {
            "Status": "running",
            "Running": true,
            "Paused": false,
            "Restarting": false,
            "OOMKilled": false,
            "Dead": false,
            "Pid": 3408,
            "ExitCode": 0,
            "Error": "",
            "StartedAt": "2018-09-05T17:45:20.19489647Z",
            "FinishedAt": "0001-01-01T00:00:00Z"
        },
        "Image": "sha256:4b07159e407beba7d74f1986d3b90e3103f33b87269991400ca2fd1eedf1f4eb",
Weave Scope is a tool used to monitor Kubernetes in real time, and there was no reason for it to be running gcc. At this point I found that the "gcc" binary was actually a cryptocurrency miner with the filename gcc.
objdump:
admin@ip-10-10-201-13:/$ objdump -sj .rodata /gcc
...
 f0c00 584d5269 6720322e 362e320a 20627569  XMRig 2.6.2. bui
 f0c10 6c74206f 6e204d61 79203330 20323031  lt on May 30 201
 f0c20 38207769 74682047 43430000 00000000  8 with GCC......
...
Furthermore, the binary was running from the host machine’s root directory and not from a container. Using Weave Scope to gain more insight into what this container was doing, an outbound connection to a mining pool further confirmed my suspicions.

Immediate Action
Day 3, 19:03 EST: After identifying Weave Scope to be the source of spawning the miner masquerading as gcc, the team was immediately notified. Working in parallel,
Weave Scope was stopped and its deployment was removed from all our Kubernetes clusters.
Access logs were checked for any signs of unauthorised access to our instances.
The
gccprocess outbound connections were inspected and found to only communicate with a mining pool.A Google search for
XMRigled to a GitHub repository for a Monero miner. Combing through the source confirmed that its only function is to mine Monero.One of the affected nodes was isolated from the cluster for future investigation.
All nodes in each cluster were rotated out to ensure all affected entities were destroyed and rebuilt.
Discovering the Attack Vector
Finding a cryptocurrency miner on our internal clusters was alarming and indicative of a vulnerability in the software we were running or an issue with our setup. Because Weave Scope was the parent process that spawned the miner, I checked for CVEs related to Weave and Weave Scope, sifted through the GitHub issues, and looked to see if any similar cases existed. No known vulnerabilities were published, no traces of DNS tampering or unauthorised access into our clusters was found, and the Docker image hash for Weave Scope matched the published image on DockerHub.
The next step I took to determine an attack vector was launching a new barebones, isolated Kubernetes cluster with our existing deployment method. Watching over the entire process exposed the first issue — the Weave Scope load balancer security group was public facing and exposed to the world.

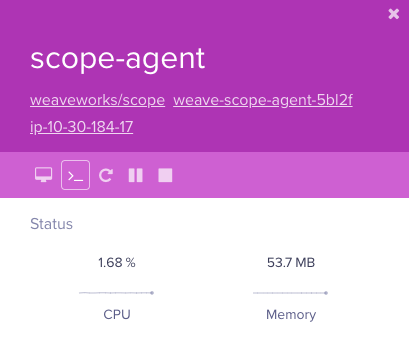
Anyone with our load balancer URL can access the Weave Scope dashboard without any authentication. Having metrics exposed to prying eyes will provide attackers information to work with, however one Weave Scope feature, in particular, was abused. The documentation on Weave Scope’s Github repository advertises that one of the features included is the ability to launch a command line on running containers:
Interact with and manage containers Launch a command line.
Interact with your containers directly: pause, restart and stop containers. Launch a command line. All without leaving the scope browser window.

In the GUI, the terminal prompt icon presents a user with an interactive shell to the container. Even so, by design containers have a certain amount of separation from its host. An exposed load balancer along with our specific Kubernetes cluster configuration allowed arbitrary code to break out of the container and run on the host instance. Looking at the default Weave Scope configuration file for load balancers for reference,
k8s-service-type - Kubernetes service type (for running Scope in Standalone mode), can be either LoadBalancer or NodePort, by default this is unspecified (only internal access)
Our deployment was missing the annotation to make the load balancer internal:
- apiVersion: v1
  kind: Service
  metadata:
    name: weave-scope-app
    annotations:
      cloud.weave.works/launcher-info: |-
        {
          "original-request": {
            "url": "/k8s/v1.8/scope.yaml?k8s-service-type=LoadBalancer",
            "date": "Thu Sep 20 2018 17:37:19 GMT+0000 (UTC)"
          },
          "email-address": "support@weave.works"
        }
  #--TRUNCATED--
  spec:
    ports:
      - name: app
        port: 80
        protocol: TCP
        targetPort: 4040
    #--TRUNCATED--
    type: LoadBalancer
The
weave-scopecontainer is running with the--privilegedflag:spec: containers: - name: scope-agent #--TRUNCATED-- image: "docker.io/weaveworks/scope:1.9.1" imagePullPolicy: IfNotPresent securityContext: privileged: true #--TRUNCATED--Files on the root file system were mounted onto the container:
#--TRUNCATED--
volumeMounts:
  - name: scope-plugins
    mountPath: /var/run/scope/plugins
  - name: sys-kernel-debug
    mountPath: /sys/kernel/debug
  - name: docker-socket
    mountPath: /var/run/docker.sock
#--TRUNCATED--
Containers are run as the
rootuser.
Replicating the Attack
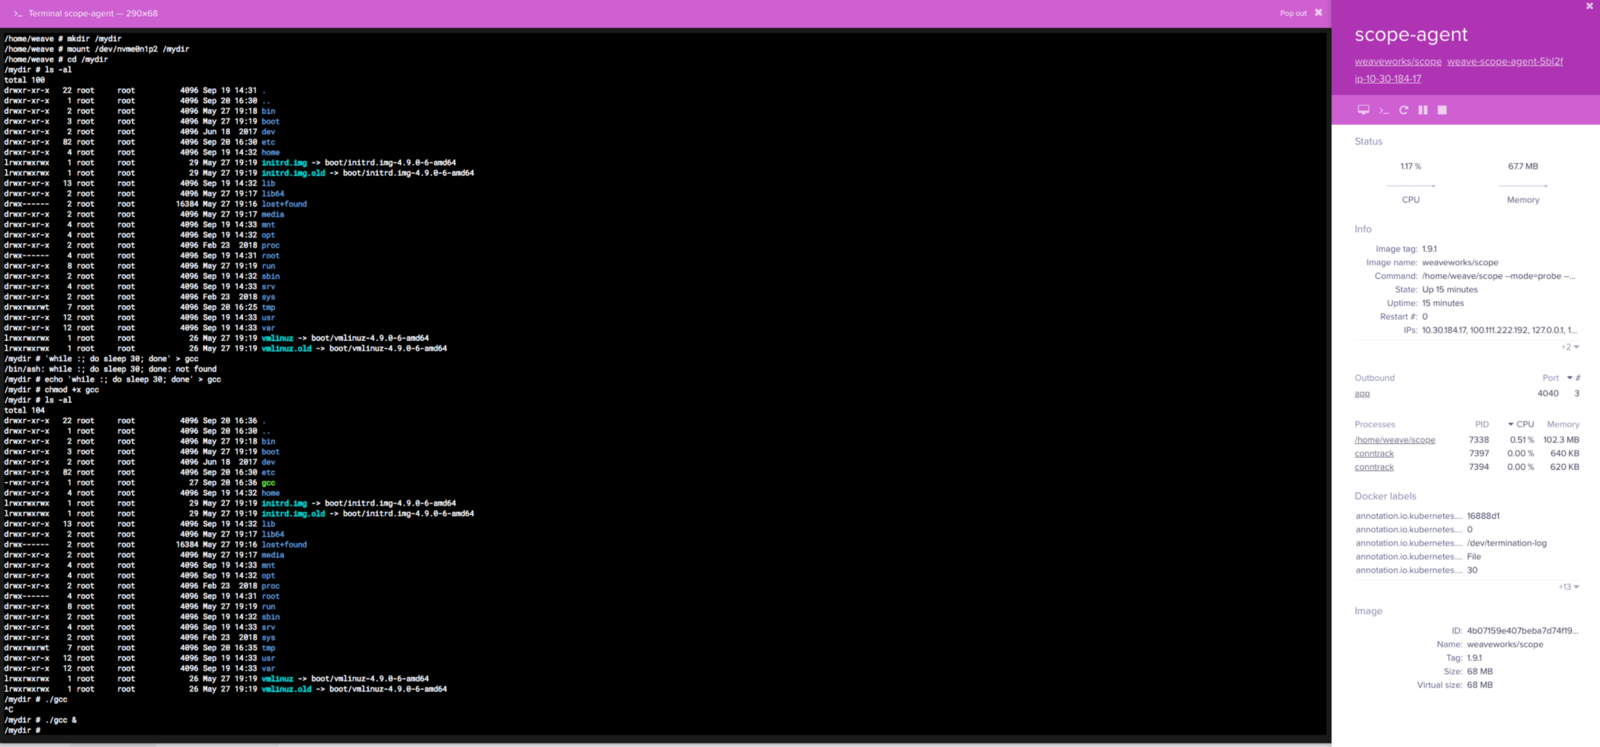
Simulating the attacker, a scope-agent container would be ideal to run commands on due to having elevated privileges.
Demonstrated above, the host volume can be mounted onto the Docker container. This matches the listing on the underlying host. I created a simple bash script to run in the background to show that it can run on the host machine as root.

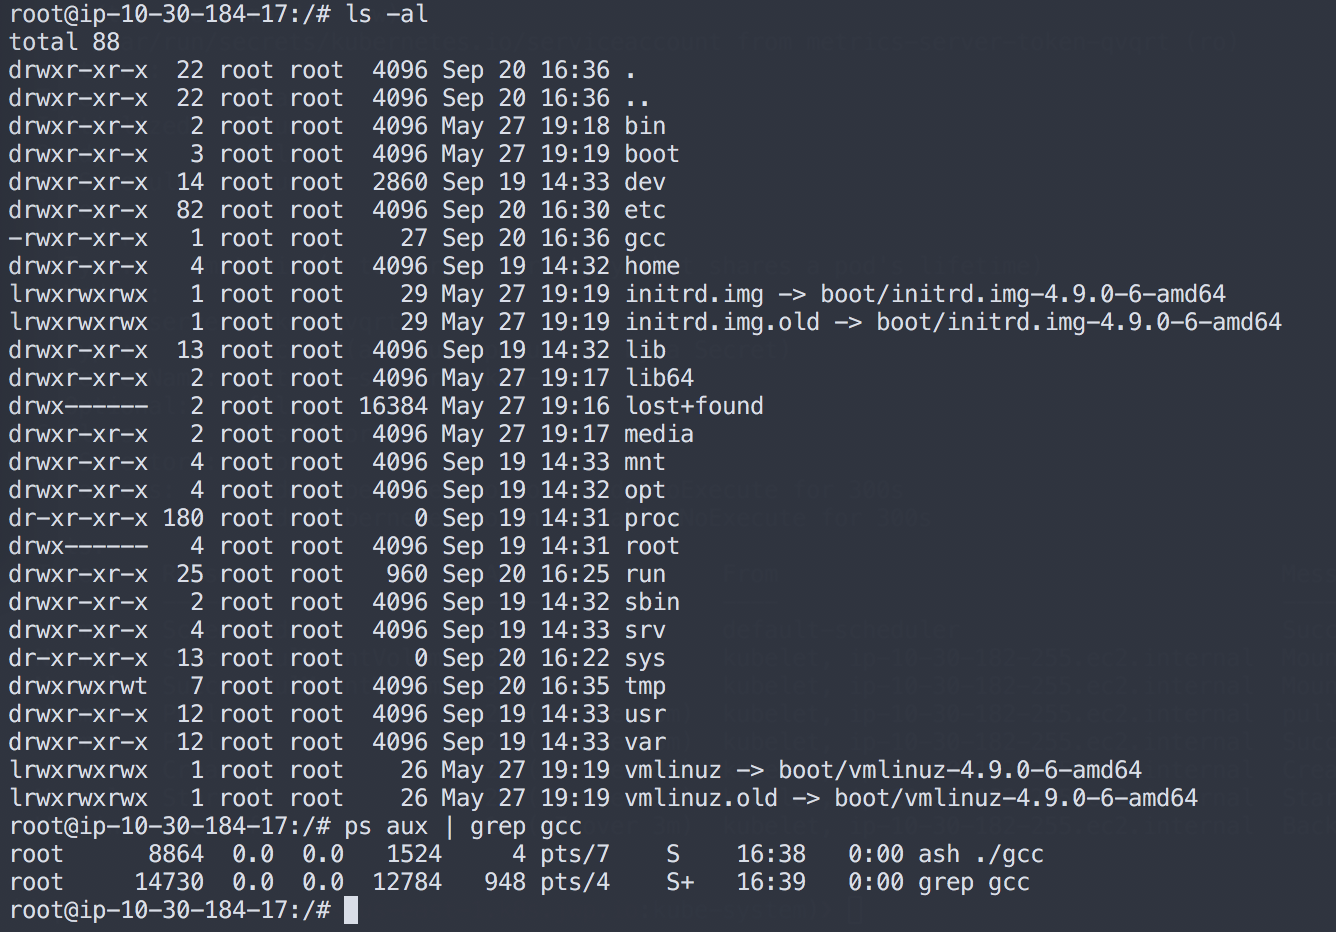
Through SSH on the host machine, the gcc file created through the scope-agent container is visible and running.

Using the same method as in our original diagnosis, we see that gcc is running and identify the parent:
root@ip-10-30-184-17:/# ps aux | grep gcc
root      8864  0.0  0.0   1524     4 pts/7    S    16:38   0:00 ash ./gcc
root     14730  0.0  0.0  12784   948 pts/4    S+   16:39   0:00 grep gcc
root@ip-10-30-184-17:/# cat /proc/8864/status
Name:   busybox
Umask:  0022
State:  S (sleeping)
Tgid:   8864
Ngid:   0
Pid:    8864
PPid:   21594
One slight difference here is the parent PID of the gcc bash script points to /bin/ash instead of the Docker container that spawned the process:
root     21284  0.0  0.0  12784  1028 pts/4    S+   16:40   0:00 grep 21594
root     21594  0.0  0.0   1536   960 pts/7    Ss+  16:30   0:00 /bin/ash
root@ip-10-30-184-17:/# cat /proc/21594/status
Name:   ash
Umask:  0022
State:  S (sleeping)
Tgid:   21594
Ngid:   0
Pid:    21594
PPid:   21578
The parent of that process is a Docker container:
root@ip-10-30-184-17:/# ps aux | grep 21578
root     21578  0.0  0.0 199064  3756 ?        Sl   16:30   0:00 docker-containerd-shim b9652096ff9a8b524f7d9ce7688e9709fb24bcc31ffa7e7c3484c8cf117cc56a /var/run/docker/libcontainerd/b9652096ff9a8b524f7d9ce7688e9709fb24bcc31ffa7e7c3484c8cf117cc56a docker-runc
root     24923  0.0  0.0  12784   988 pts/4    S+   16:40   0:00 grep 21578
root@ip-10-30-184-17:/# docker inspect b9652096ff9a8b524f7d9ce7688e9709fb24bcc31ffa7e7c3484c8cf117cc56a
[
    {
        "Id": "b9652096ff9a8b524f7d9ce7688e9709fb24bcc31ffa7e7c3484c8cf117cc56a",
        "Created": "2018-09-20T15:59:01.868162531Z",
        "Path": "/home/weave/scope",
        "Args": [
            "--mode=probe",
            "--probe-only",
            "--probe.docker.bridge=docker0",
            "--probe.docker=true",
            "--probe.kubernetes=true",
            "weave-scope-app.weave.svc.cluster.local:80"
        ],
        "State": {
            "Status": "running",
            "Running": true,
            "Paused": false,
            "Restarting": false,
            "OOMKilled": false,
            "Dead": false,
            "Pid": 7338,
            "ExitCode": 0,
            "Error": "",
            "StartedAt": "2018-09-20T16:22:57.100773796Z",
            "FinishedAt": "2018-09-20T16:22:56.994841933Z"
        },
        "Image": "sha256:4b07159e407beba7d74f1986d3b90e3103f33b87269991400ca2fd1eedf1f4eb",
The slight difference may be attributed to the attack being automated and more sophisticated than the manual reproduction described. This example is also only one of several ways to break out of a privileged container. If applied to all Weave scope-agent containers, the miner can be executed on all instances since scope-agent is running on each instance to gather metrics.
Damage Assessment
An unwanted application gaining access to the root directory on all of our Kubernetes nodes is alarming. In addition to our immediate steps, further analysis was imperative to ensure that our data has not been accessed or compromised in any way.
- Access logs show there were no outside logins into the host machines.
- The Kubernetes API was not accessed by the intruder.
- The load balancer URL was not shared and access to the Weave Scope dashboard was discovered by an automated crawler. We verified that running a cryptocurrency miner was the sole purpose of this automated attack.
- The entire extent of damage done was having 100% CPU usage on one core on each of our Kubernetes instances in our development and staging environments. Pod scheduling and service was uninterrupted.
- The production cluster was completely unaffected.
When designing our Kubernetes 1.10 cluster, we wanted to take advantage of the new and improved RBAC changes since 1.7.4. In the event of a more malicious attack, our current design already contains measures in place to limit access.
- Our RBAC permissions restricted Weave Scope’s access, scoping it to only the
weavenamespace. If the Kubernetes API was queried for sensitive information such as our Kubernetes secrets, those requests would be denied. - Despite being able to break out of the container and access the underlying host filesystem, no sensitive information is stored on our Kubernetes nodes.
- No published exploits or CVEs have been reported for our Kubernetes and Docker versions that would allow an attacker to retrieve output from commands run on the underlying host. Even if an attacker were to install and run a listener on the host to run arbitrary code, they would not be able to connect back due to the way our load balancer listeners and networking are set up.
To wrap up our damage assessment, an audit was done on all our Kubernetes and custom deployment yaml configuration files, and security groups, to ensure our services were not unintendedly public facing or misconfigured.
Consequences of Manual Modifications
The oversight of creating a public load balancer open to the world for an internal dashboard is not normal for our team. Our AWS CloudTrail logs showed that Kubernetes initially attached a security group defaulting to 0.0.0.0/0 access to port 80 when the load balancer was created. The security group was then properly configured to block all ingress traffic from non white-listed IPs through a manual edit on the AWS Console. However that voids my claim on how the attack was performed.
After pinpointing the deleted load balancer, its CloudTrail history contains the creation date along with a detailed event containing the security group’s identifier. Looking up that security group’s history shows that the manual edit made to firewall off unwanted traffic was reverted by Kubernetes shortly afterward.

Questions regarding Kubernetes reverting security group edits are present in the project’s GitHub issues. In this particular issue, a Kubernetes contributor explains:
…the way Kubernetes works, the ELB is owned by Kubernetes and you should never be forced to modify the resource manually…
We normally strictly adhere to the practice of having infrastructure as code and the load balancer should have been defined as internal, or the security group rules should have been defined in our Kubernetes yaml configuration files. In hindsight, a redeploy of Weave Scope would have reverted the manual change and needed to be manually edited back in.
Recap
At JW Player, the DevOps team has frequent code reviews and weekly architectural discussions. Prior to this incident, we had many planning sessions and discussions around upgrading our existing Kubernetes 1.7.4 cluster to 1.10.x. A mix of untimely events and decisions allowed this miner to make its way onto our clusters.
We recently migrated to a new Kubernetes version onto a new cluster with different instance sizes. Unprecedented behaviour was expected during this period.
Response time to this incident was slightly dulled by untimely alerts for a legitimate service creating noise and almost masking this issue.
Some decisions were inherited from older infrastructure and stuck around, such as running containers as the
rootuser.A manual change was made to a Kubernetes managed resource.
Next Steps
Learning from this lesson and moving forward, we have plans in place to harden our security. First, we learned monitoring on load is not the most effective measurement to determine if there is an issue with the Kubernetes clusters. Our first step is to improve alerting and diagnosis by first determining more insightful monitors, then tweaking them to give us assurance that there is, in fact, an anomaly present instead of being dulled to multiple alarms from an influx in workload.
To prevent this particular attack and future attacks from happening, we are researching use of tools such as falcon or sysdig for behavioural monitoring, and anomaly and intrusion detection. Istio and Linkerd may be useful in capturing and controlling end to end network traffic to observe and prevent unauthorised access. We are also analysing the computational cost of scanning Docker images and containers for known vulnerabilities.
To improve our process as a team, some time in our architectural discussions has been partitioned to revisit choices made in the past such as containers running as root. We also acknowledge that some information has been siloed off to certain team members, and embracing DevOps means this information should be shared. Communication is integral to our team, and being aware of these faults enables us s to make time to shift focus onto giving each engineer more visibility on big projects such as a large scale Kubernetes version migration.